


When the mobile phone first hit the Nigerian market back in 2001, they were a symbol of status, prestige and influence. Only the rich could afford them. The famous Nokia 3310 retailed for tens of thousands of Naira, and a SIM (Subscriber Identity Module) card would have set you back thousands more.
Fast forward to 2021, and literally millions of Nigerians own, not just mobile phones, but smartphones and odds are you’re reading this from your phone as well. You, alongside millions of Nigerian adults, use a smartphone for just about everything – browsing the web, streaming movies, reading a book, or finding that perfect playlist for your two-hour commute to work.
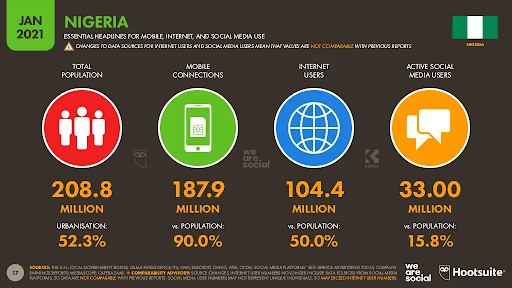
That’s not all; there are over 187.9 million mobile subscribers in Nigeria. 93% of all internet users in the country browse the web via their mobile phone. If mobile is the future, then the future is now.
This is why mobile marketing (along with mobile marketing analytics) is a crucial strategy for brands, whether you’re a top 100 company on the Nigerian Stock Exchange or a local startup that wants to thrive.
What is mobile analytics?
Mobile analytics is any method that involves the measurement and evaluation of web and app data on mobile devices. This helps paint a clear picture of how people are interacting with a mobile site or app, giving you valuable and actionable consumer insights.
As more people are now mobile, it makes sense that marketers run targeted campaigns at mobile devices. In a country where more people have access to phones than tablets and desktop computers, crafting a mobile-first approach is the way to go. Plus, what’s the good of marketing without measurement and analytics?
Why is mobile analytics so important?
With mobile analytics, marketers can easily decipher user habits on their devices. Data such as how people use your app, the mobile sites they frequent, where they are located, and so much more.
Whether you’re a fashion business looking to spread the word on your latest designs, or a bank that wants new savings accounts sign ups, mobile analytics data is crucial in finding and engaging with your customers.
Say you’re a fashion designer who makes wedding dresses and you just finished setting up your website (which of course is mobile friendly) you’ll want to know how your audience is interacting with the site.
Measuring metrics such as click-through-rate, page views, location, top pages and others will help you understand how successful your marketing campaign is and whether or not you need to make adjustments. Analytics give you such insightful understanding of your audience’s behaviour that the data can even help make changes to your products themselves.
Should mobile analytics be measured separately from web analytics?
The short answer is no. And this is reflected in how seamlessly tools like Google Analytics merge web and mobile data to paint a unified portrait of the user. You need to look out for cross-device tracking – analysing data of users who interact with your site via multiple devices at different times.
However, significant differences still exist between data on both platforms. On mobile, for example, people are always on the move; whether they’re on a bus, jogging or just walking around an apartment complex. This makes getting location data possible, unlike desktop computers.
Also, there is a glaring disparity in screen sizes between mobile and desktop devices. Most modern smartphones have a screen size of 5 to 7 inches and no more. Screen sizes on desktop computers are much larger.
This single factor plays a massive role in how content is structured on mobile devices (and how users interact with them). Google Analytics, and most other platforms, recognise this and present metrics in a unified manner to aid understanding of consumer behaviour, whether they are on mobile, desktop or tablet devices.
How mobile analytics work
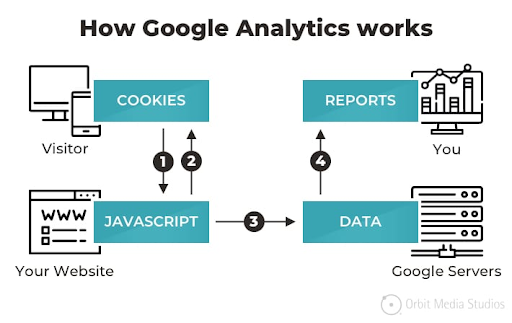
Analytics on mobile web apps work by using a tracking code (usually a snippet of JavaScript).
When a user visits a site with a tracking code, the code is triggered and goes on to collect information about the user and their device. Standard metrics include screen resolution, operating system, browser, and so much more; all this information is processed by the data collection service (such as Google Analytics servers if you use that platform) and interpreted in a dashboard.
Data collection for mobile apps is a little bit more complicated. For one, apps are more deeply integrated into the hardware of a device than webpages. A lot of apps even interact with other apps. For example, searching for “Stranger Things” on Google will show you a link to Netflix (if you have the app installed on your device) that you can click and start watching the show.

Mobile app analytics factors in triggers like these and others (such as launch frequency, time spent per session, daily active users and crash reports). Additionally, mobile apps are largely restricted to the devices and operating systems they were built for. A native Android app, for example, would need to be rebuilt in order to function on an iPhone.
7 Mobile analytics metrics you should be paying more attention to in 2021
While having a firm understanding of all the data surrounding your mobile site or app will help your business optimise and grow, there are some metrics that are perhaps more critical in helping you understand consumer behaviour.
Compatibility
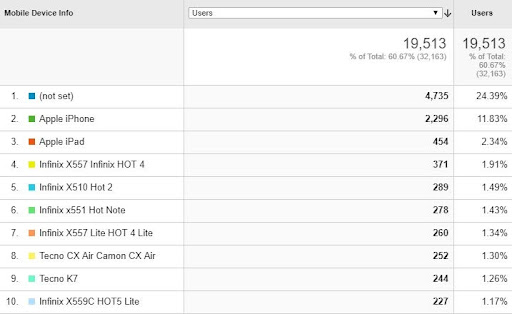
In Nigeria alone, over 82% of users who access the internet do so on mobile devices. That’s a lot of people, using phones from different manufacturers, different operating systems and even different browsers. It, therefore, makes sense to prioritise a mobile-friendly website.
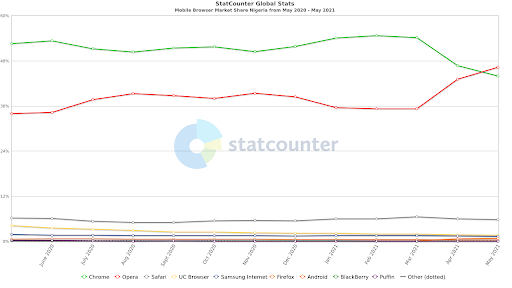
A webpage that displays as intended on one device or browser may come out distorted on others. From the chart below, mobile web traffic in Nigeria is still divided across different browsers. You have to make sure your website appears perfect on all of them if you don’t want to lose a share of your users or customers.
Device and operating system (OS) compatibility is also a major factor to consider when studying mobile analytics. With Android and iOS being the two largest mobile operating systems in Nigeria, it makes sense to have two versions of your app to account for both sets of users. Platforms like Google Analytics will also show you what OS your site users are originating from, and you can do a lot with this information. For one, it can help you diagnose if users in a particular operating system are having challenges using your app.
Site visits and app installs
After ironing out any compatibility challenges facing your mobile site or app, the next metrics to pay attention to is the number of people who visit your site or download your app. Visits and installs usually help you gauge the popularity of your website or app.
Most analytics tools also show you where the visits to your mobile site or installs of your app came from, and this is crucial in helping figure out a lot about your target audience. For example, if you know that a lot of people are discovering your brand via organic search engine results, then you may want to double down on your Search Engine Optimisation (SEO) strategy, or even start a pay-per-click (PPC)) campaign, to capitalise on that native interest.
Paths and user behaviour
How people interact with your site (when they click on a link) or your mobile app (when they install and launch it) will give you some of the most insightful information about your target audience. The most popular pages, for example, will provide you with a good indication of your top content that you may want to create more of.
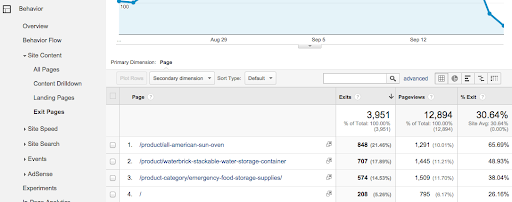
Analysing user paths is also essential for diagnosing any issues that may be present in your mobile site or app. One way to figure this out is checking which exit points – pages where users leave your website or app. In Google Analytics, you can find this in Behavior > Exit Pages. This data is crucial for discovering user experience issues such as broken links, distorted content, app crashes, and many more.
User retention
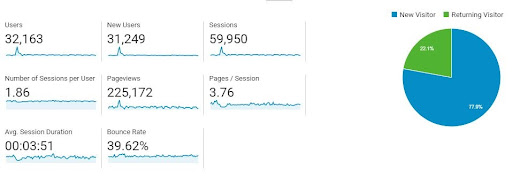
Throughout the lifecycle of your website or app, there will be users who only visit once or download the app and never launch/use it. This is why measuring retention metrics such as new/returning users (for a mobile site) and daily active users (for an app) will get much more important insights than site visits, and app installs as time progresses.
Furthermore, while acquiring new users every month is great, you also want to make sure that your returning user base is growing. This is even more important if you have a news site, a blog, forum, etc. – these are industries where you want people to visit your website or use your app daily.
App permissions
The launch of Android 6.0 Marshmallow in 2015 changed the way mobile developers built apps and how users interacted with them. The update integrated app permissions into the OS, allowing users to dictate what segments and data of their device apps can or cannot access. iOS devices have a similar feature.
In this age of privacy, app permissions are a crucial factor in gauging the trustworthiness of your app among users. If people are comfortable with your brand and app, they are more likely to grant permissions such as push notifications, location access and others that are relevant to your app.
Crash reports
The diversity of operating systems, devices and even app versions make crash analytics an essential metrics to watch out for. Integrated tools like Google’s Firebase or Apple’s Xcode will give you detailed insights into what user actions (or lack thereof) caused a crash of your app, helping you figure out bugs and other technical anomalies harming the user experience.
Custom events
As websites and apps vary, so do users and how they interact with these products. The good thing is that you can set up custom event tracking to help you measure metrics that may not be captured organically by the analytics platform you are using.
If you run a subscription based service with both paid and free users, for example, you may want to distinguish between how the two sets of users interact with your app. Data like this can help you immensely in your marketing efforts aimed at growing revenue.
One challenge you’ll need to overcome is the technical know-how required to implement these custom metrics tracking, especially on mobile apps. In the end, whichever custom data you choose to track will depend on your brand and industry; a stock trading app, for example, would want to track the volume of trades and how much users are spending.
What the future holds for mobile analytics
The economy of Nigeria is such that it allows for mobile devices to dominate over desktop and tablet computers, as smartphones are a lot more affordable.
This is not a trend that is going to change anytime soon. As such, a mobile-first marketing strategy is not only a must; mobile analytics needs to be given a front-row seat.
Looking ahead, personalisation based on analytics data will draw even more focus among marketers. As competition grows, consumers demand even better products/services that are ideal for them.
Personalisation ensures that people get the ideal user experience right from the moment they launch your app or visit your site. Mobile analytics is crucial to getting here, and in the near future, we will be more informed about user behaviour like never before. The continued integration of big data systems, regression analysis and machine learning will unravel a new world for mobile analytics and help make predictions to enhance user experience, increase conversion & retention, and grow businesses.